Client reports
on autopilot.
Google Analytics, Search Console, Google Ads, Business Profile, Meta Ads, YouTube and TikTok, all in one dashboard with your logo on it. Connect once. A fresh report is ready every month. You get your Mondays back.
14-day free trial, no card needed. Read-only access: we never touch your campaigns or spend a cent.
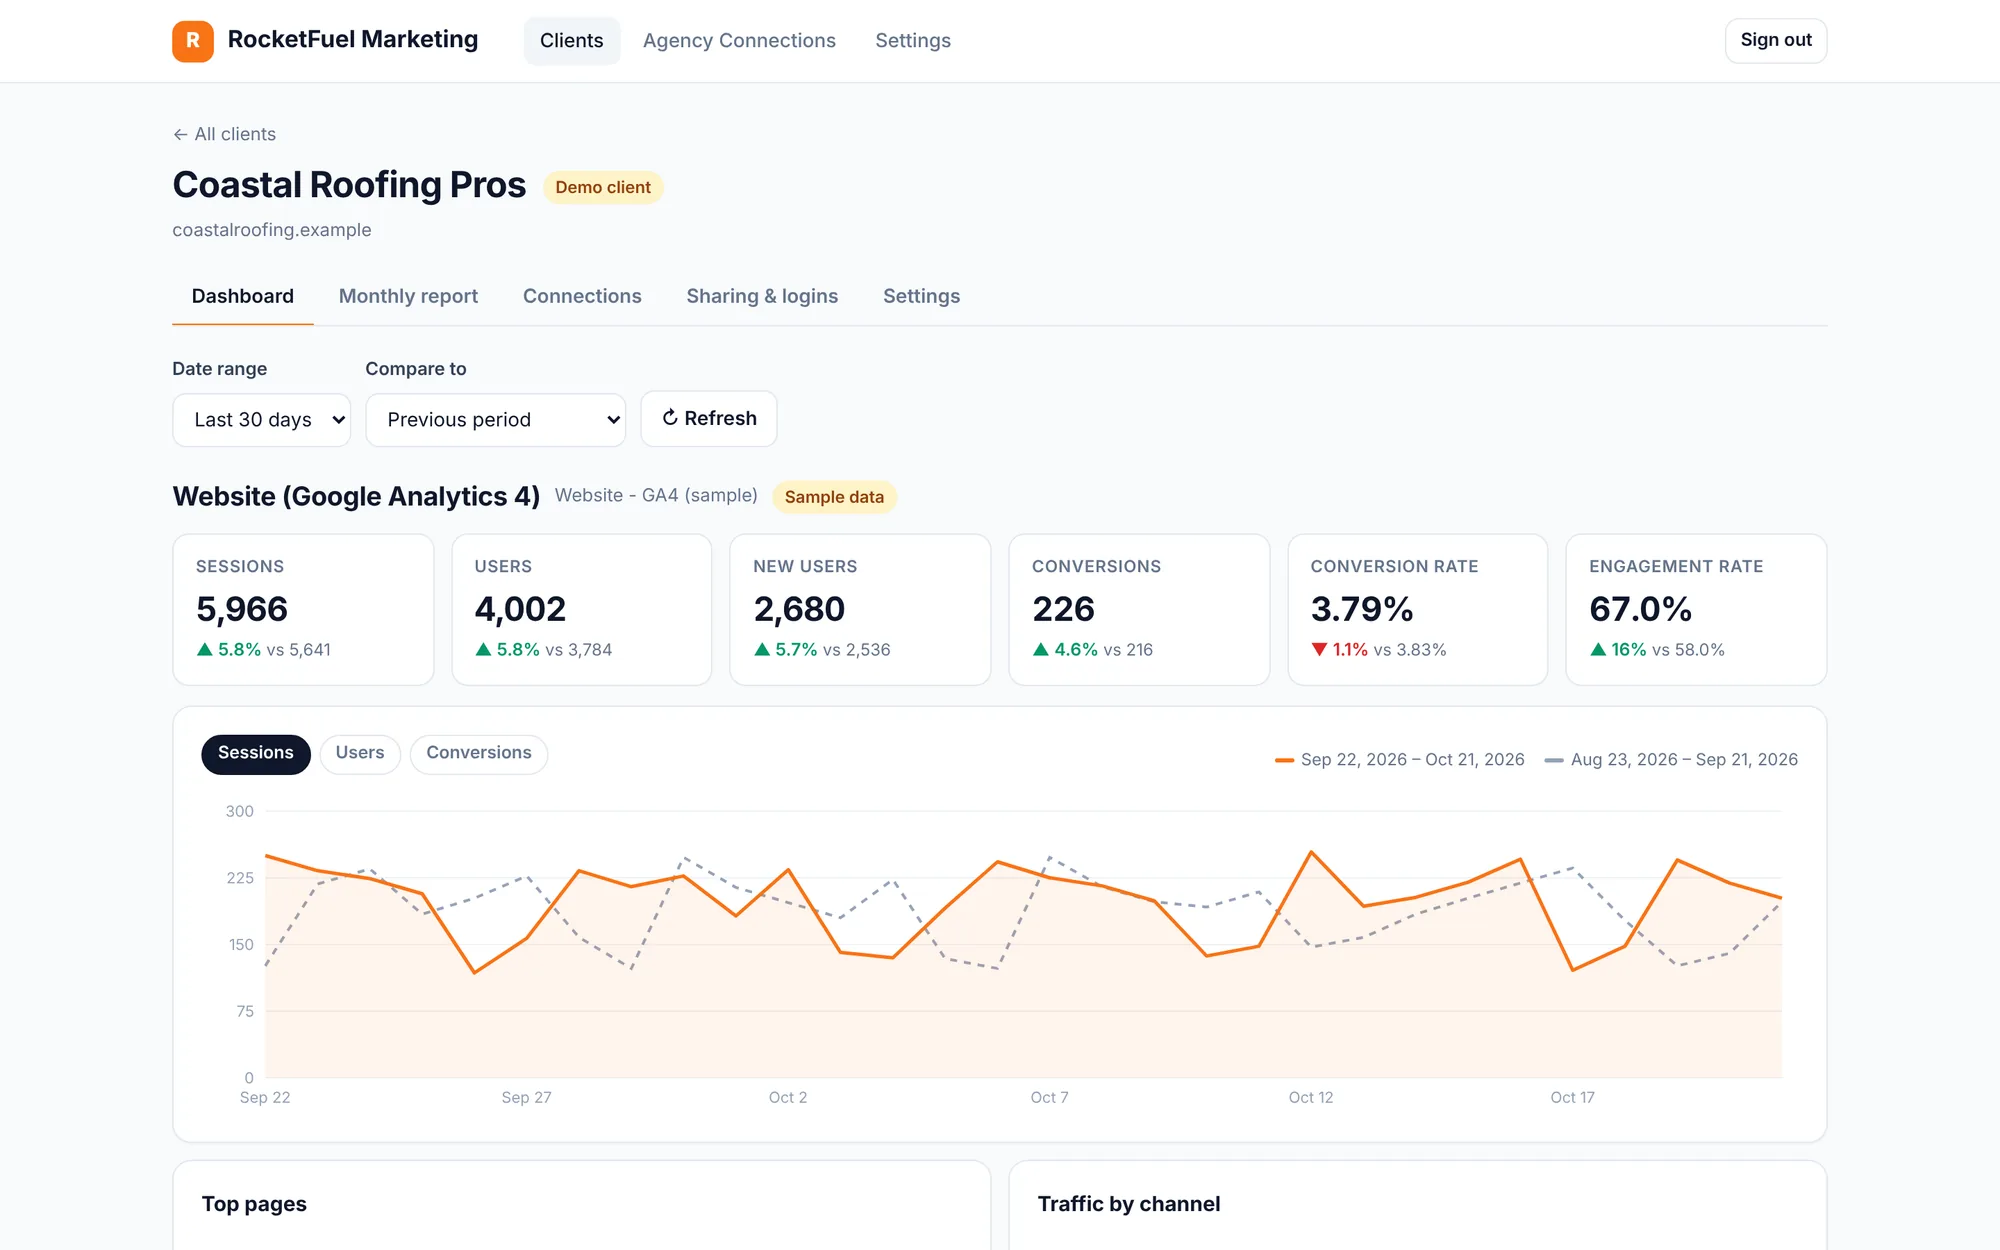
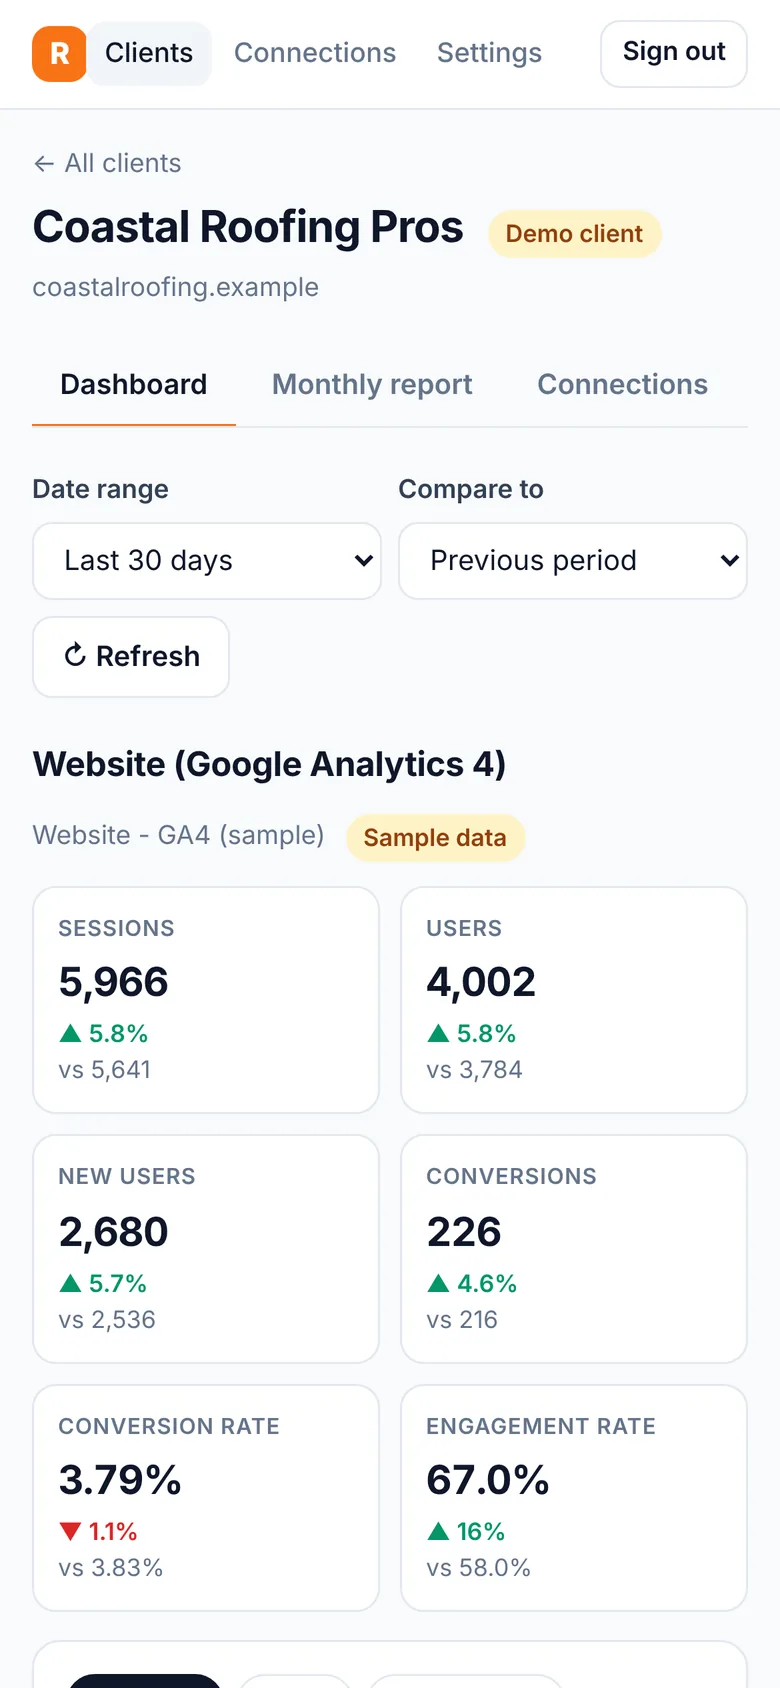
Real product screenshot · Example data
All your numbers.
One gorgeous dashboard.
Stop screenshotting seven platforms into a slide deck. ClientReports pulls the numbers that matter and makes them look great.
Google Analytics
Website traffic your clients actually understand.
- Sessions, users and conversions
- Top pages and traffic sources
- Month-over-month trends
Search Console
Show off the SEO wins, keyword by keyword.
- Clicks and impressions
- Top searches and pages
- Average position
Google Ads
Spend, results and what each lead cost.
- Spend, clicks and conversions
- Cost per conversion
- Campaign breakdowns
Business Profile
Local visibility, calls and direction requests.
- Profile views
- Calls and website clicks
- Direction requests
Meta Ads
Facebook and Instagram ads, minus the Ads Manager maze.
- Spend and impressions
- Clicks, leads and cost per lead
- Campaign performance
YouTube
Channel growth your clients can actually see.
- Views and watch time
- Subscribers gained and lost
- Top videos
TikTok Ads + organic
Paid and organic TikTok, side by side.
- Ad spend, clicks and conversions
- Video views
- Followers, likes and shares
Agency-wide connections
Connect your agency Google login and Business Manager once.
- See every client account you manage
- Pick each client's accounts from a list
- No chasing clients for passwords
No mockups.
This is the app.
Every screenshot below is ClientReports itself, running on example data. What you see is what your clients get.
Traffic, minus the jargon.
Sessions, users, conversions and engagement, with a trend line against last period. Plus top pages and where visitors came from.
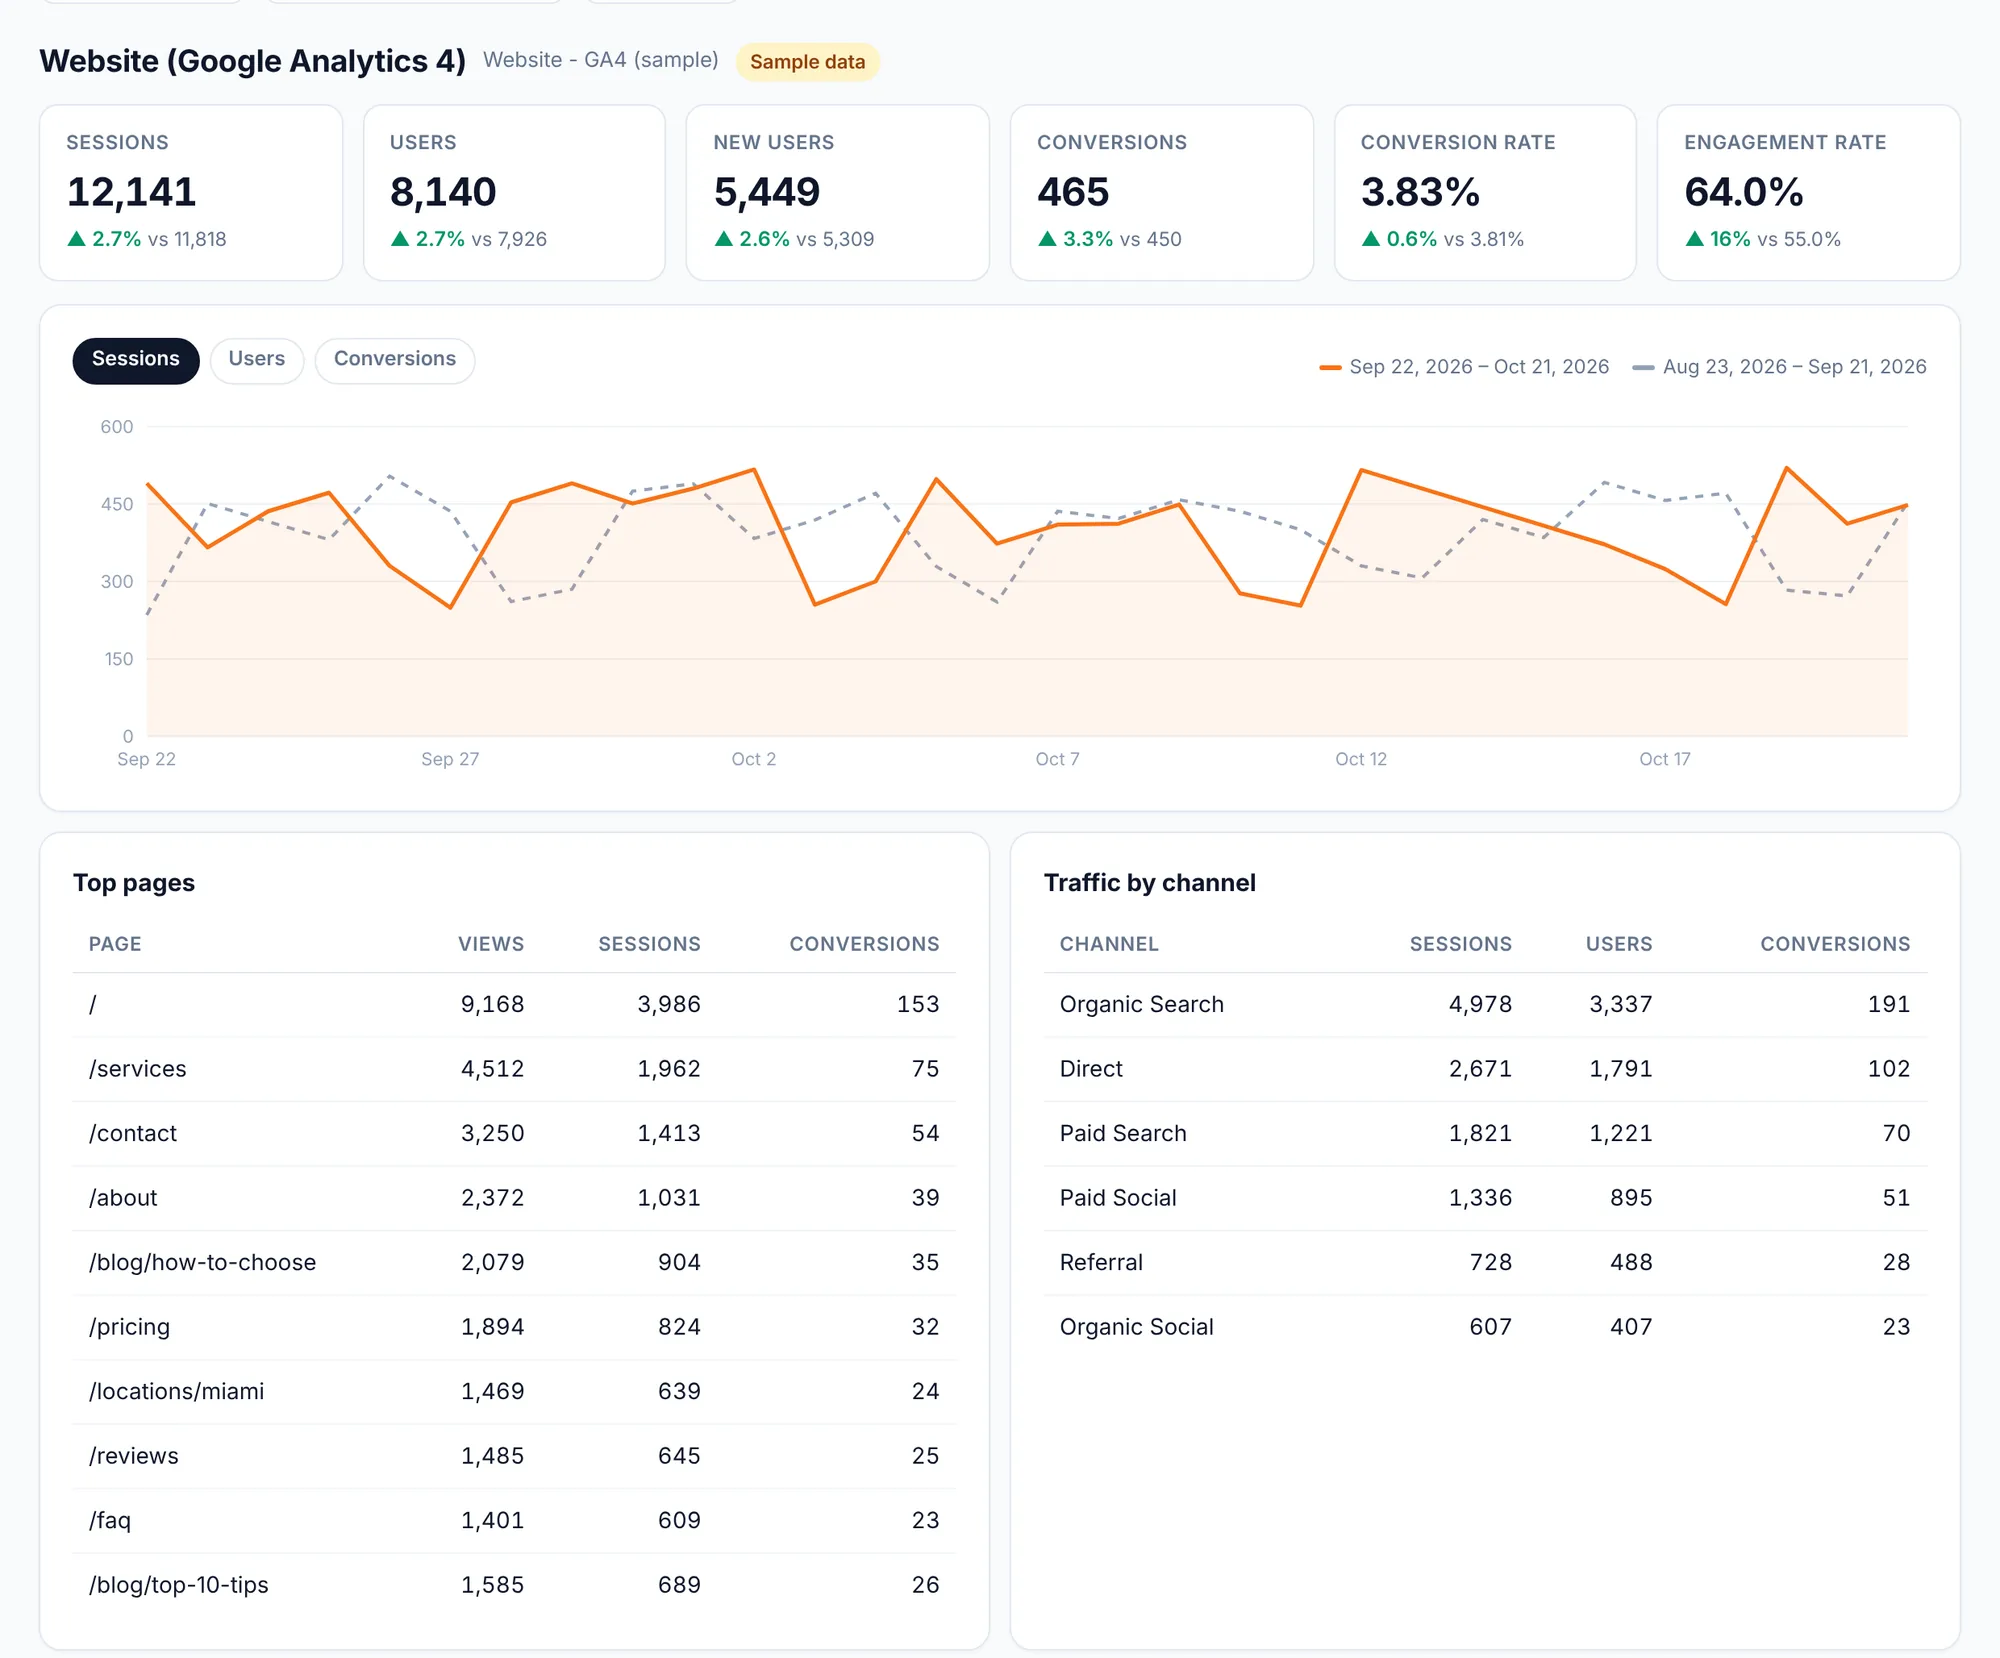
Example data
SEO wins, keyword by keyword.
Clicks, impressions, click-through rate and average position, with the top searches and top pages in Google.
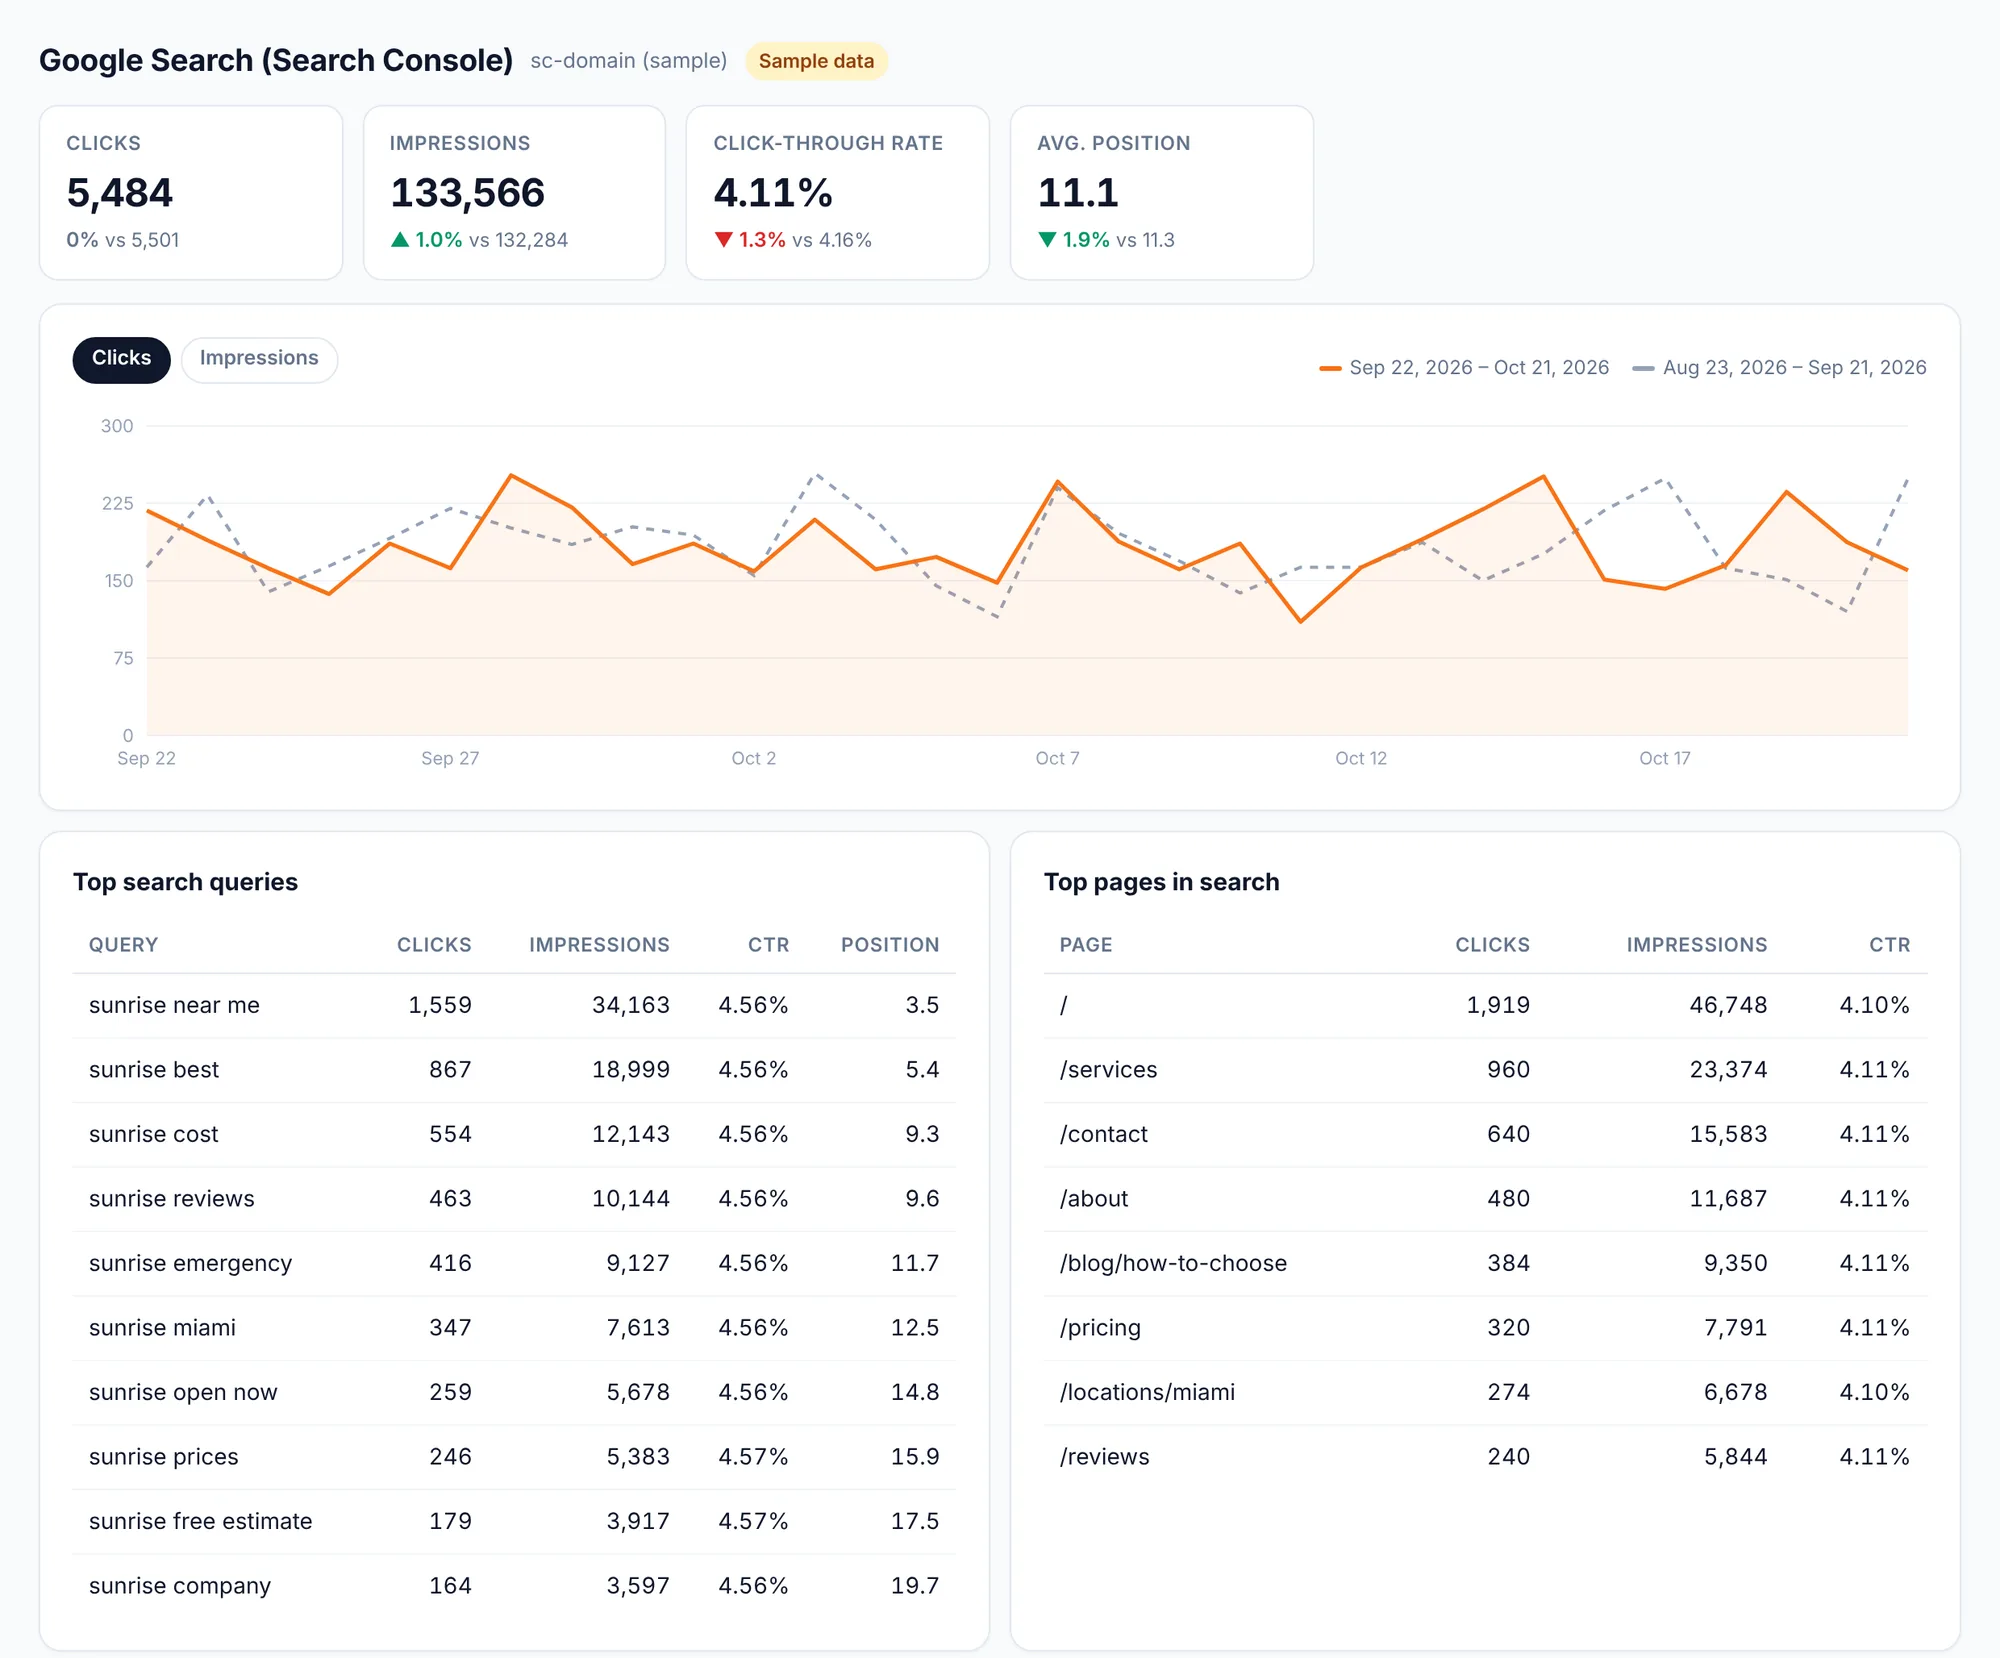
Example data
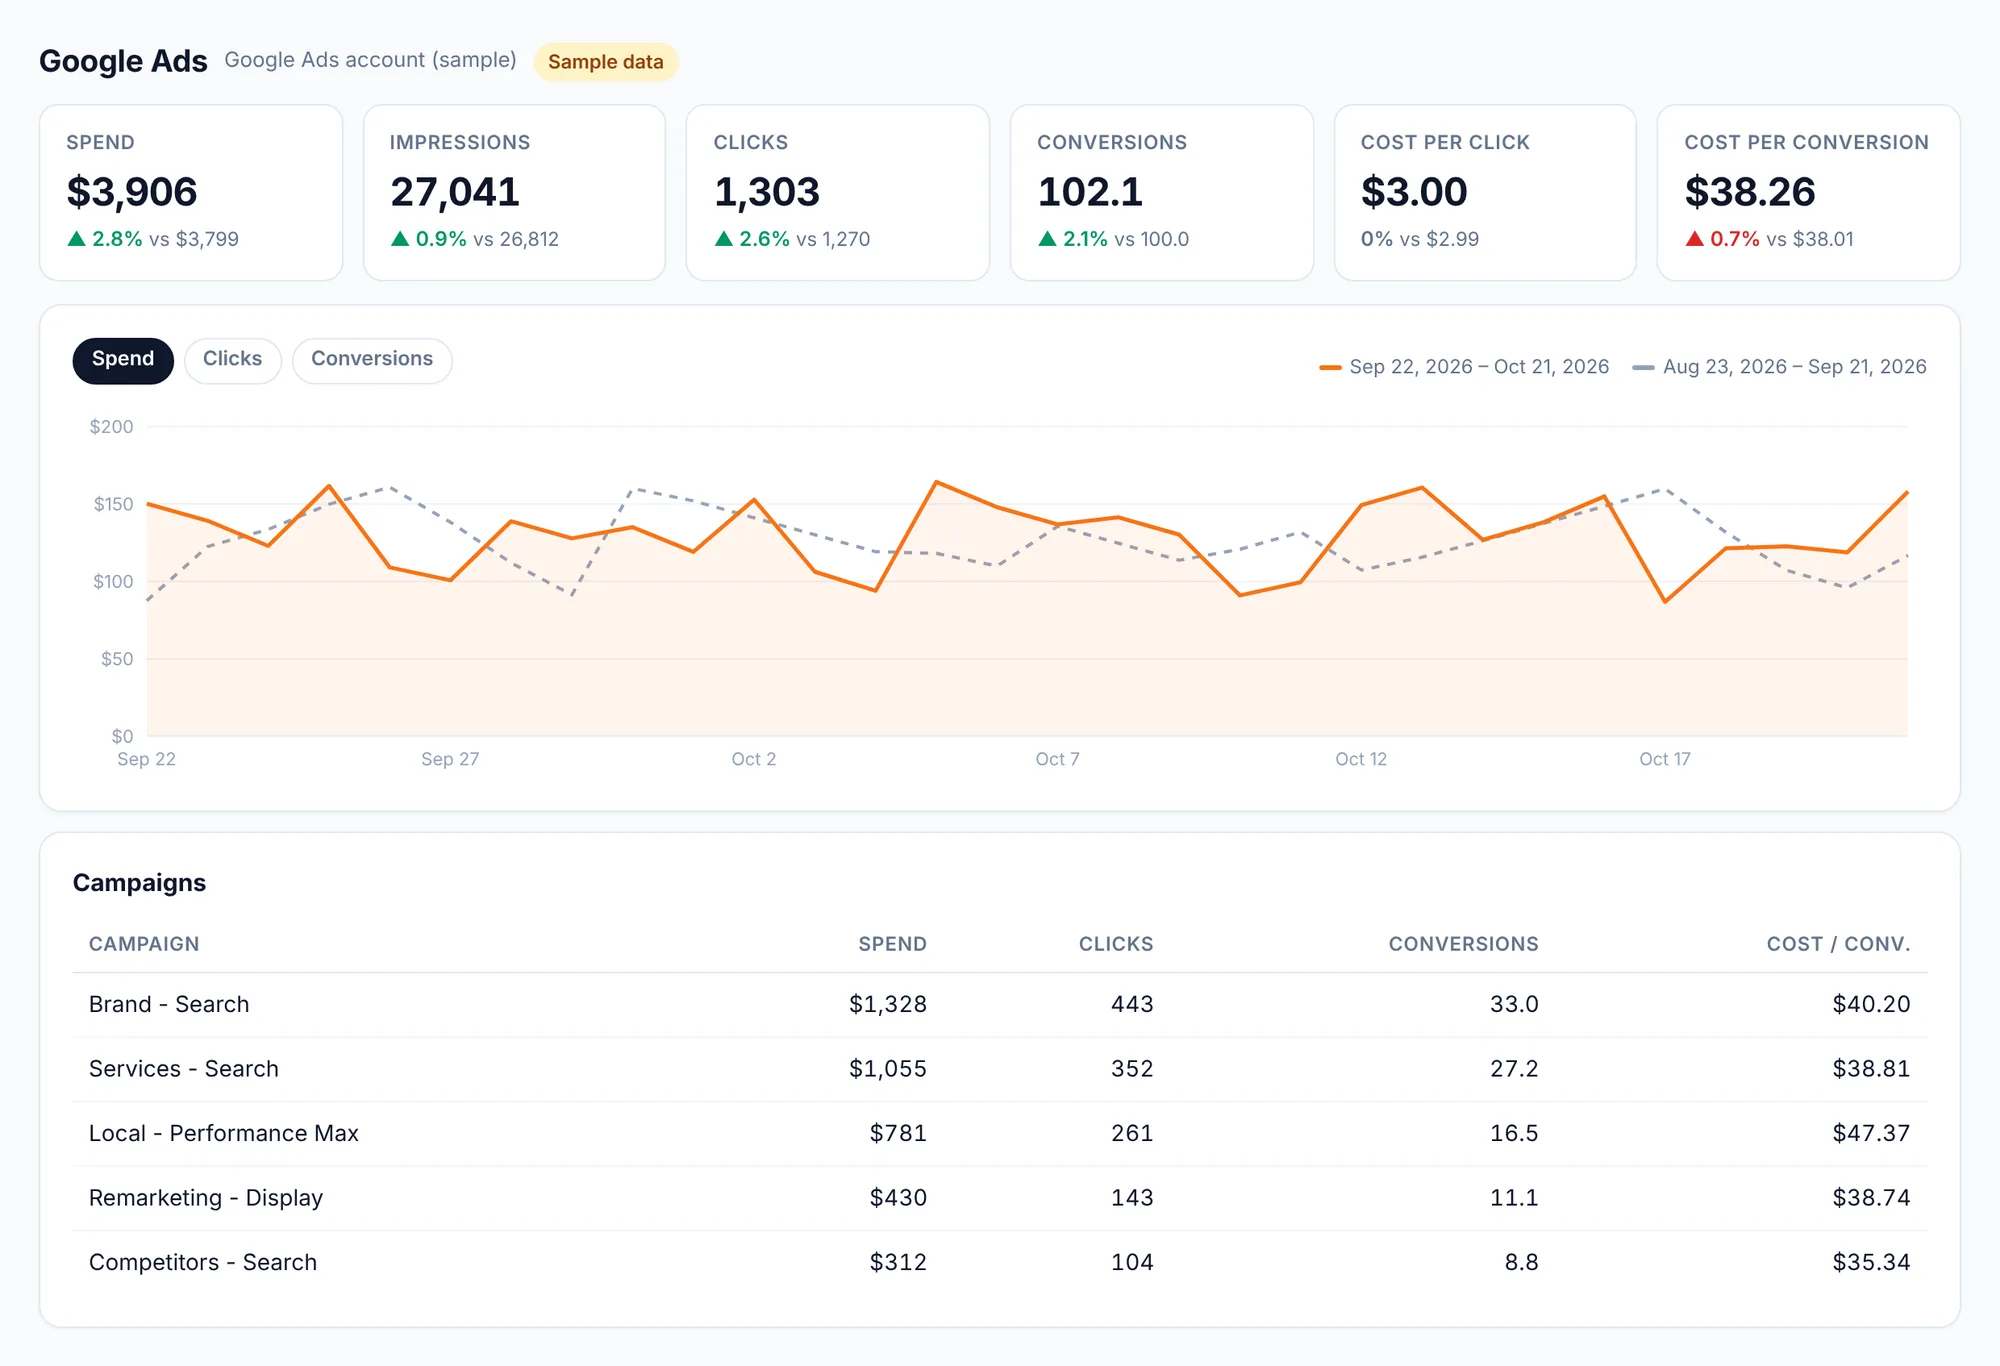
Every dollar, accounted for.
Spend, clicks, conversions and cost per conversion, broken down by campaign so clients see exactly what they paid for.
Example data
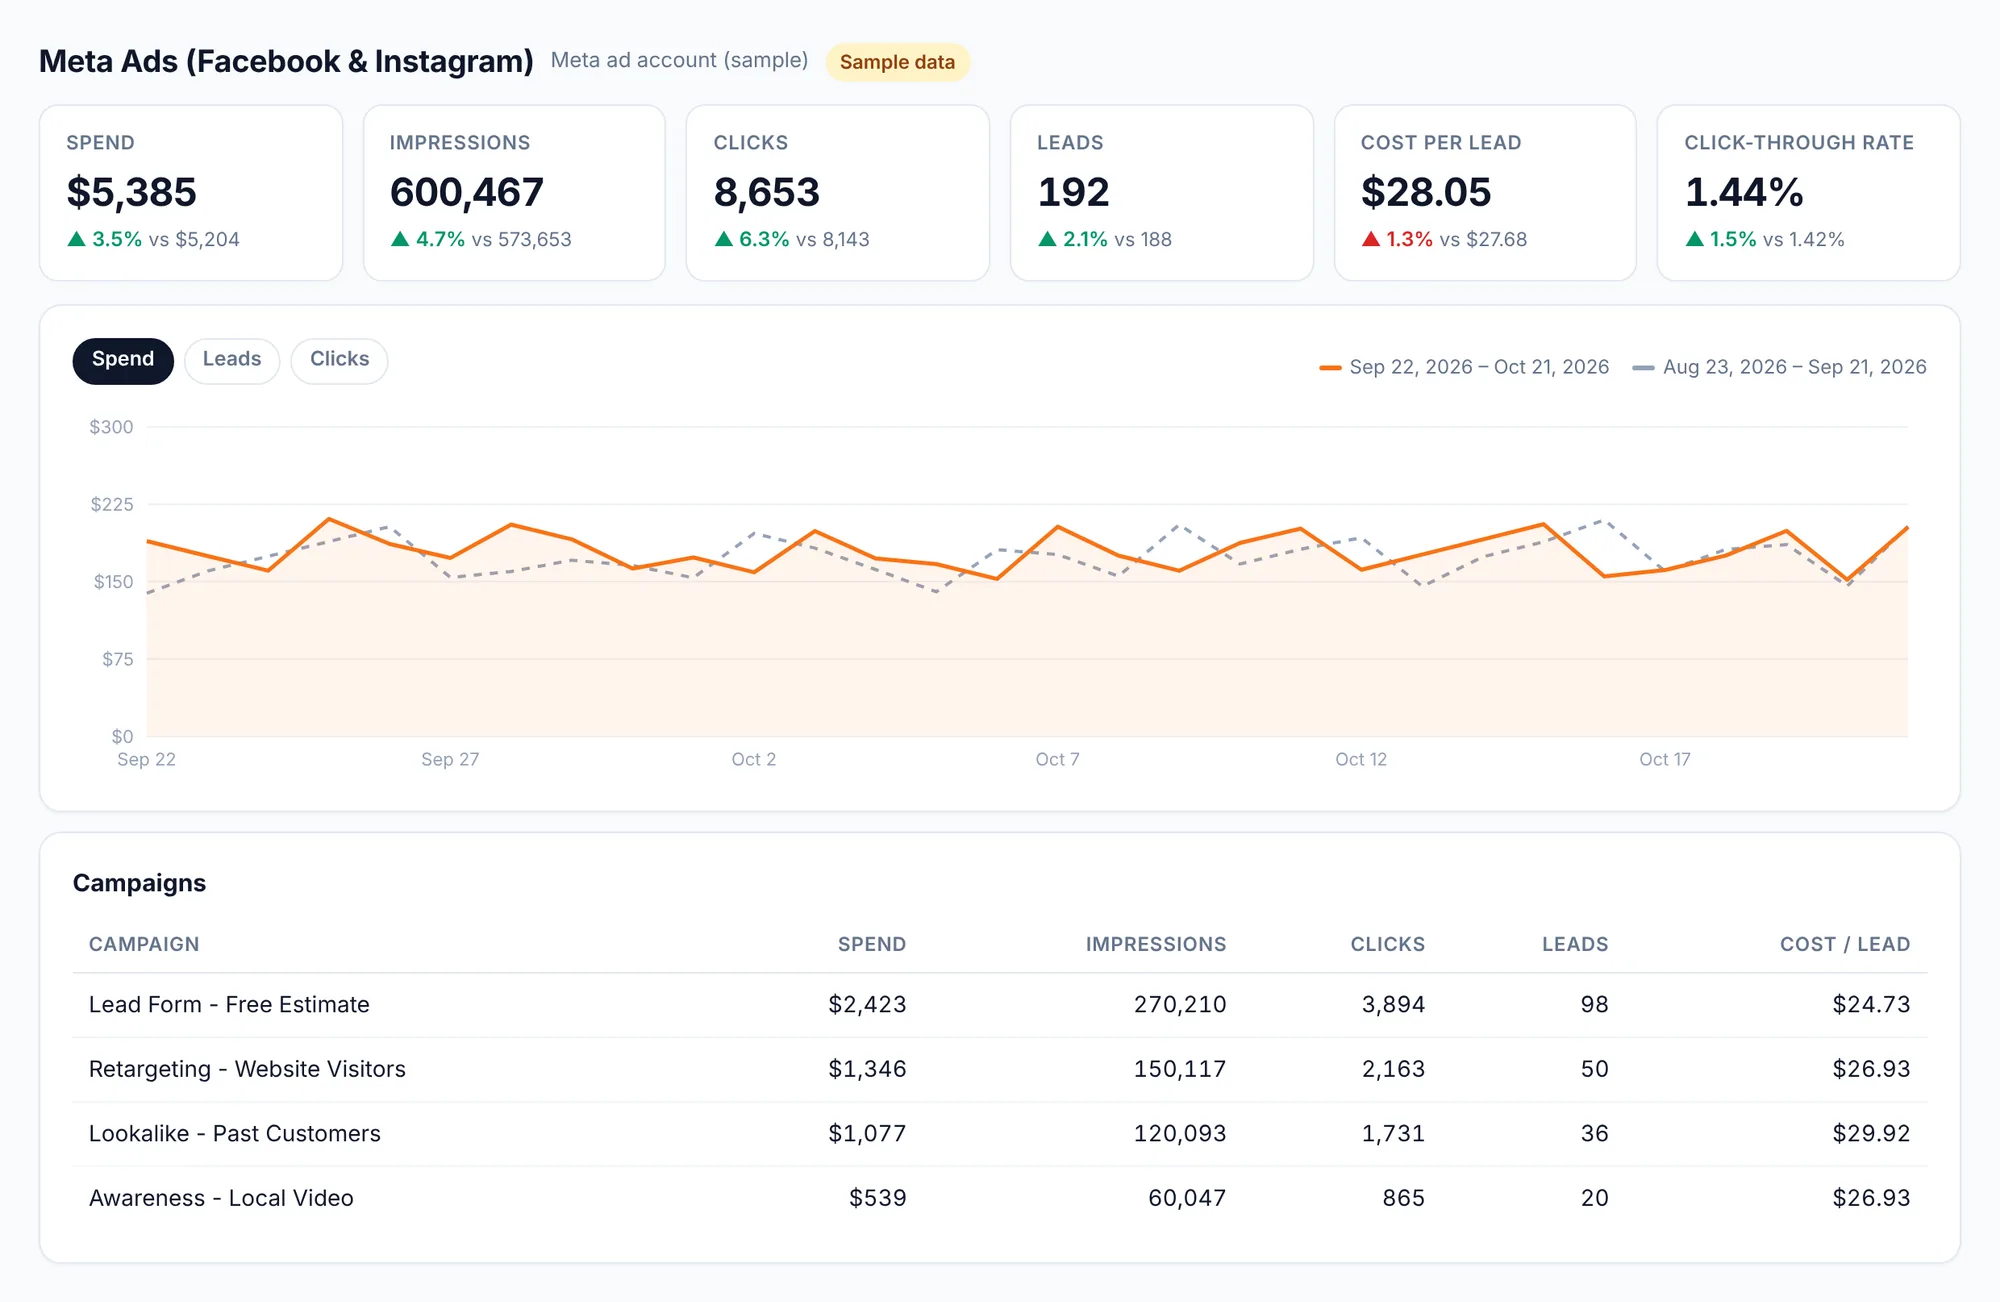
Facebook and Instagram, made simple.
Spend, reach, leads and cost per lead for every campaign. No Ads Manager maze for your clients.
Example data
Your brand.
Front and center.
Your clients see your logo, your colors and your name. Not ours. It looks like you built it yourself.
- Your logo and brand colors on every dashboard
- Client logins so clients can check in anytime
- Share links that open without a password
- Add your own notes and wins to each report
Three steps.
Zero spreadsheets.
Connect once
Sign in with your agency's Google login and Meta Business Manager. Read-only. Takes about a minute.
Pick accounts
Add a client, then pick their Analytics, Search Console, Ads, Business Profile, Meta, YouTube and TikTok accounts from a list.
Share and chill
Send a share link or a client login. A fresh monthly report is ready on the 1st, every month.
Example data
Reports that
build themselves.
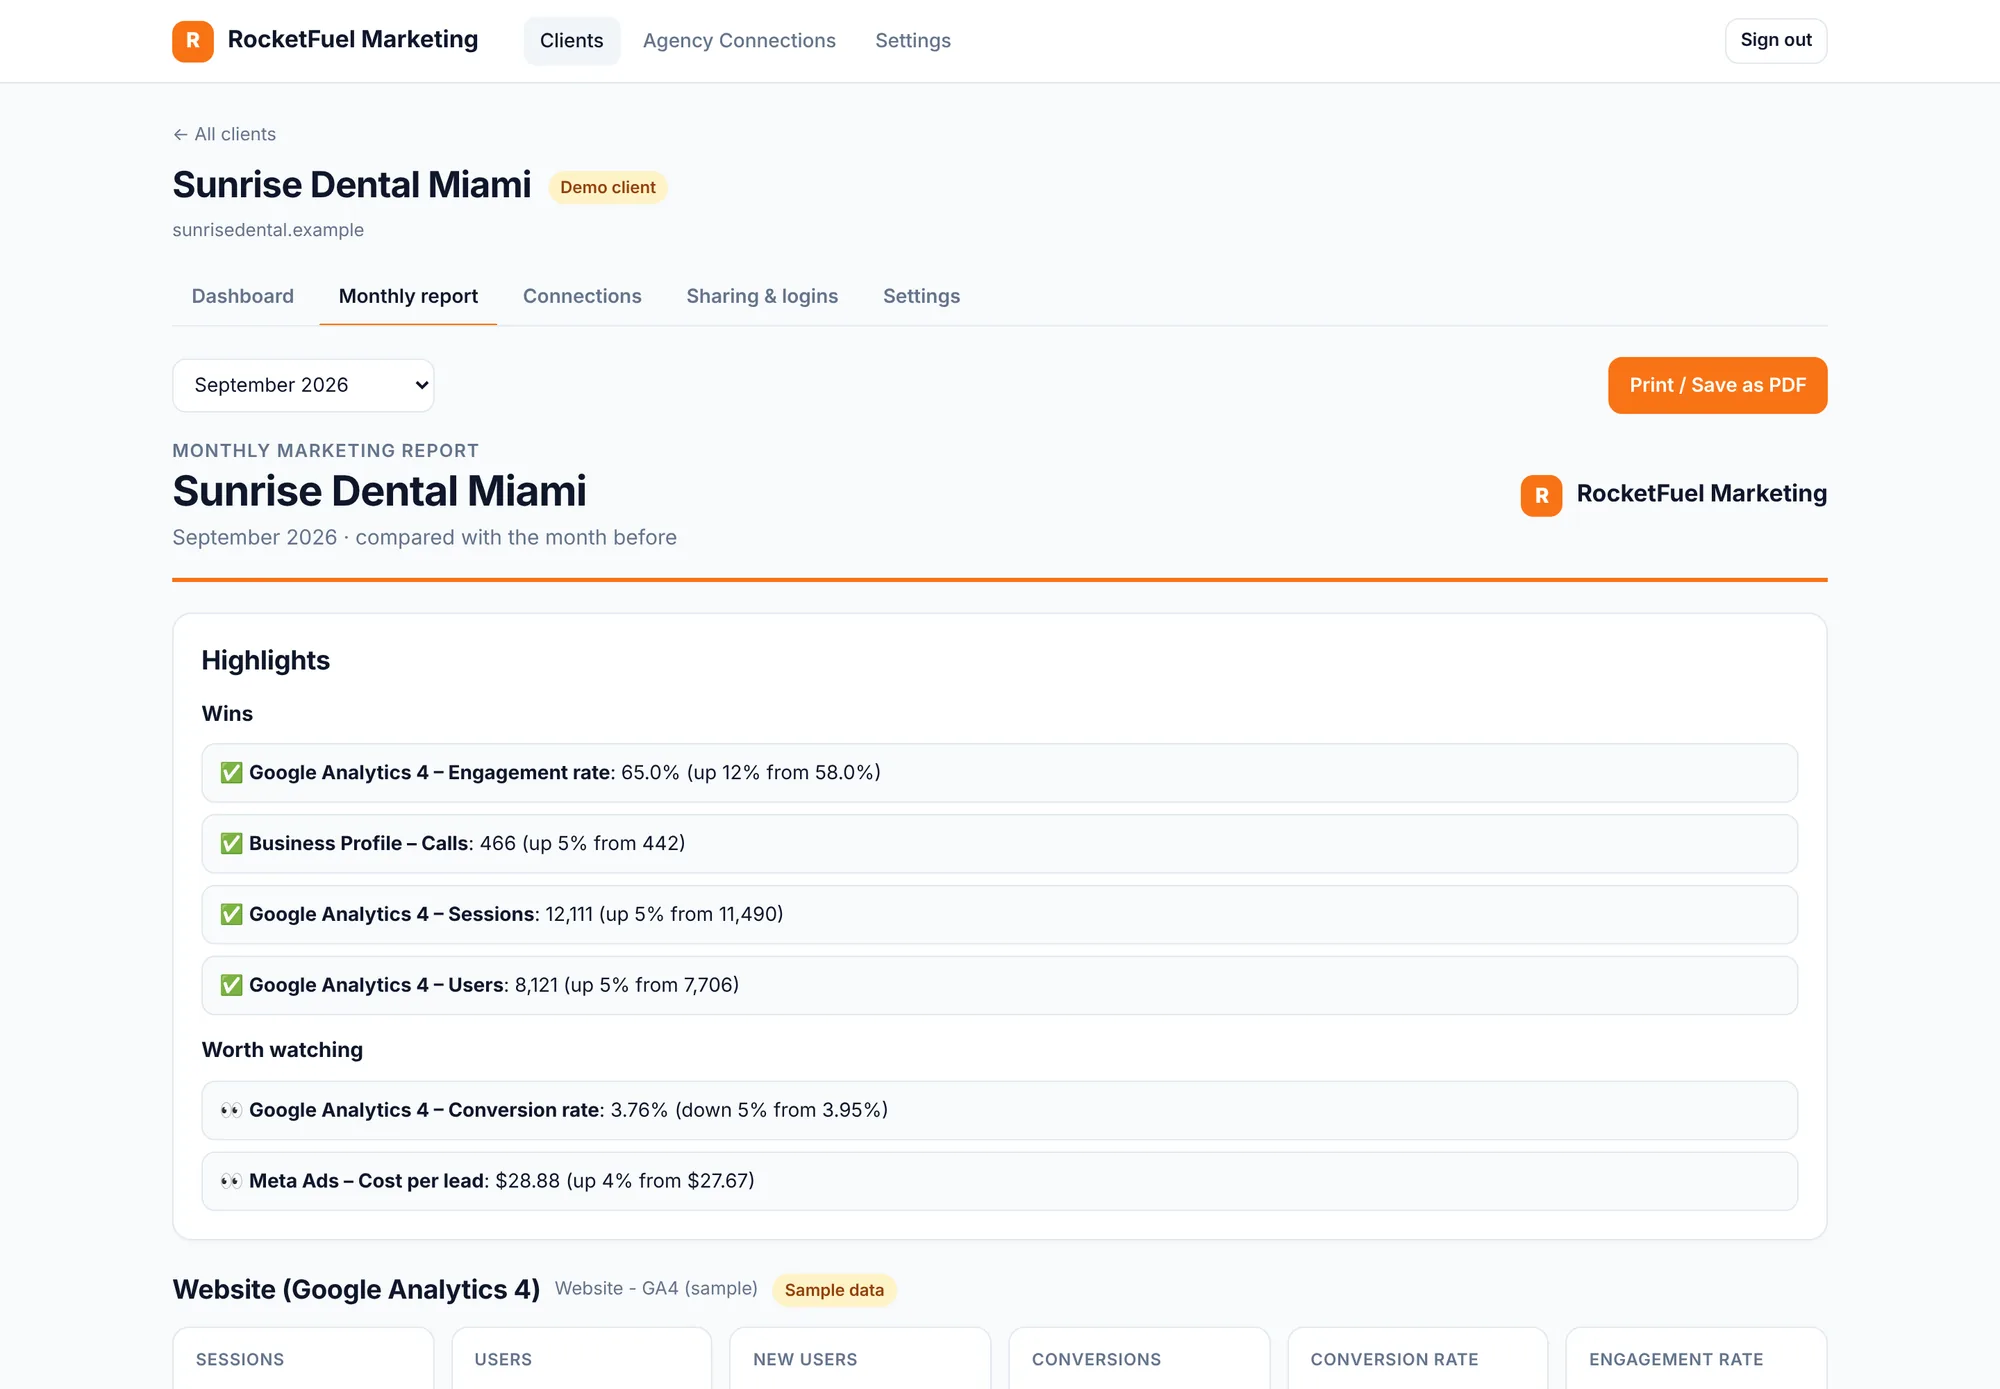
Every month, ClientReports builds a clean report for every client, compared with the month before. Add a quick note on the wins, share the link, done.
- Automatic monthly reports
- Dashboards compare to last period or last year
- Looks great on a phone
Read-only.
Locked down.
ClientReports only reads numbers. It can't edit campaigns, change budgets or spend money. Access tokens are encrypted, and you can disconnect anytime.
Encrypted tokens
Google and Meta access is stored encrypted at rest. Disconnecting deletes it.
Only who you choose
Each client sees only their own reports. Nothing is sold or shared.
Ready to ditch
the report grind?
Try it free for 14 days. No card needed. Tell us a little about your agency and we'll get you set up.